🚀 Platform Performance
A consolidated view of system performance combining overview insights, user activity, and object usage metrics to evaluate platform responsiveness, user engagement, and operational efficiency.
To access it:
➡️ Go to Analytics → Reports → Platform from the left-hand menu.
- By default, reports are displayed with a date range of one year back from today.
━━━━━━━━━━━━━━━━━━━━━━━━━━━━━━━━━━━━━━━━━━━━━━━━━━━━━━━━━━━━━━━━━━━━━━━━━━━━━━━━━━━━━
🧰 Filters
- 📅 Date Range Filter
- 🎛️ Respective Filters
Date Range Filter – Selects a specific time period for analysis.
Respective Filters – Filters data by Country, Company and Users.
- User filters are dependent on the Country and Company filters (i.e., if you select a country, it will show only the users of that country, and if you select a company, it will show only the users of that company in the user dropdown).
- The Country or Company filter alone will not provide any results.
- The Users filter alone will provide results based on the selected users.
━━━━━━━━━━━━━━━━━━━━━━━━━━━━━━━━━━━━━━━━━━━━━━━━━━━━━━━━━━━━━━━━━━━━━━━━━━━━━━━━━━━━━
📊 Overview Reports
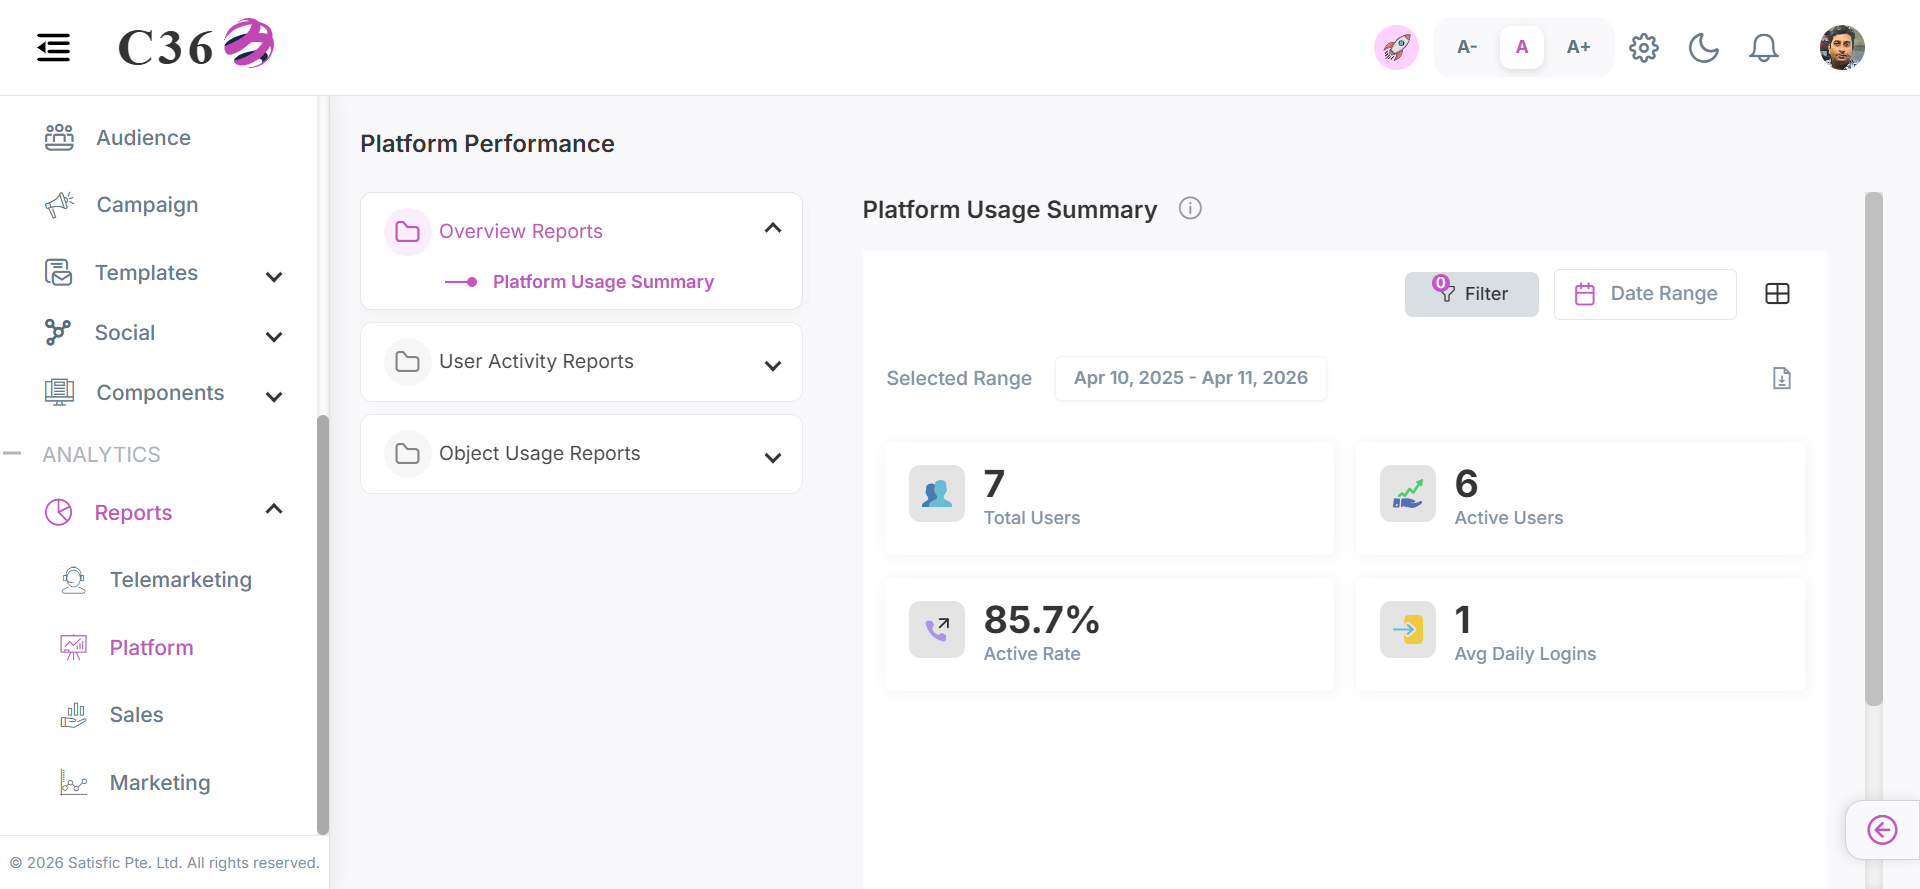
📈 Platform Usage Summary
A concise overview of user activity and system engagement, highlighting key platform usage metrics and trends.
- 📊 Chart View
- 📋 Table View
Click to see quick actions
- Can Toggle between Table view and Chart view. - Can Export/Download the report. - Can Filter by Date Range. - Can Filter by Country, Company and Users.
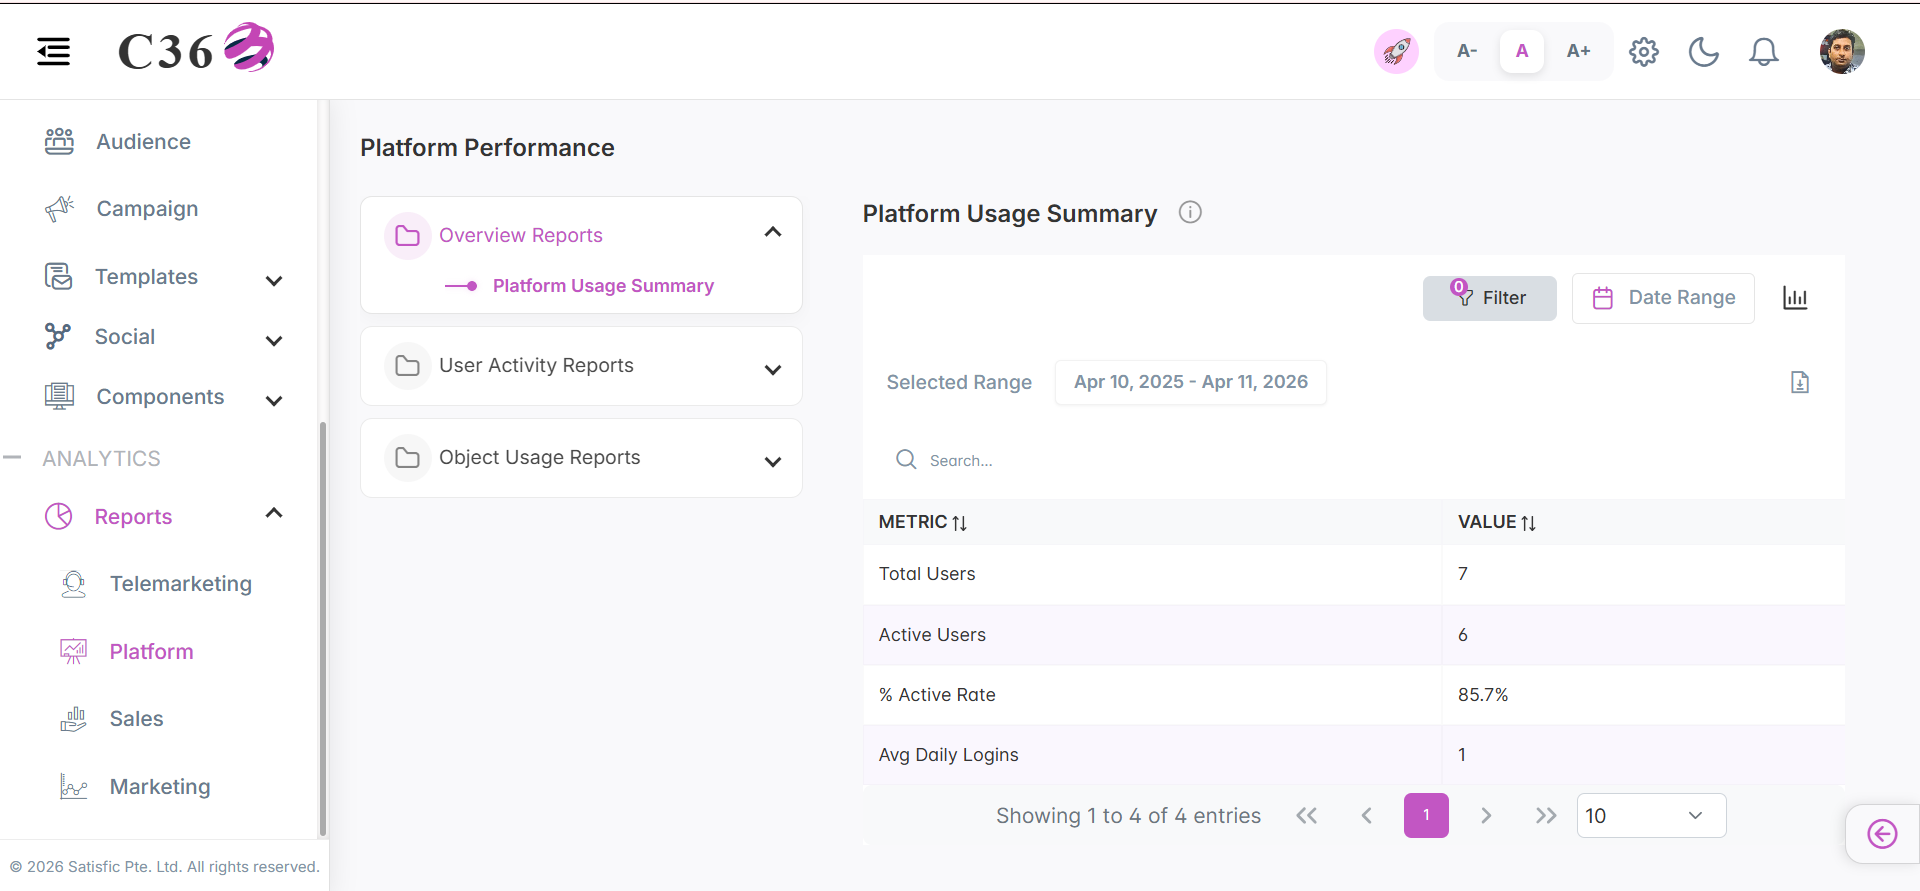
Click to see quick actions
- Can Toggle between Table view and Chart view. - Can perform Search in table view. - Can Export/Download the report. - Can Filter by Date Range. - Can Filter by Country, Company and Users.
🧾 Columns included in the table view.
| Column | Description |
|---|---|
| Total User | The total number of users verified in the CRM system who have successfully logged in. |
| Active User | The number of users actively engaging with the CRM Platform. |
| % Active Rate | The percentage of total users who are actively using the CRM. |
| AVG Daily Logins | The average number of user logins per day. |
━━━━━━━━━━━━━━━━━━━━━━━━━━━━━━━━━━━━━━━━━━━━━━━━━━━━━━━━━━━━━━━━━━━━━━━━━━━━━━━━━━━━━
👥 User Activity Report
🏆 Login Leaderboard
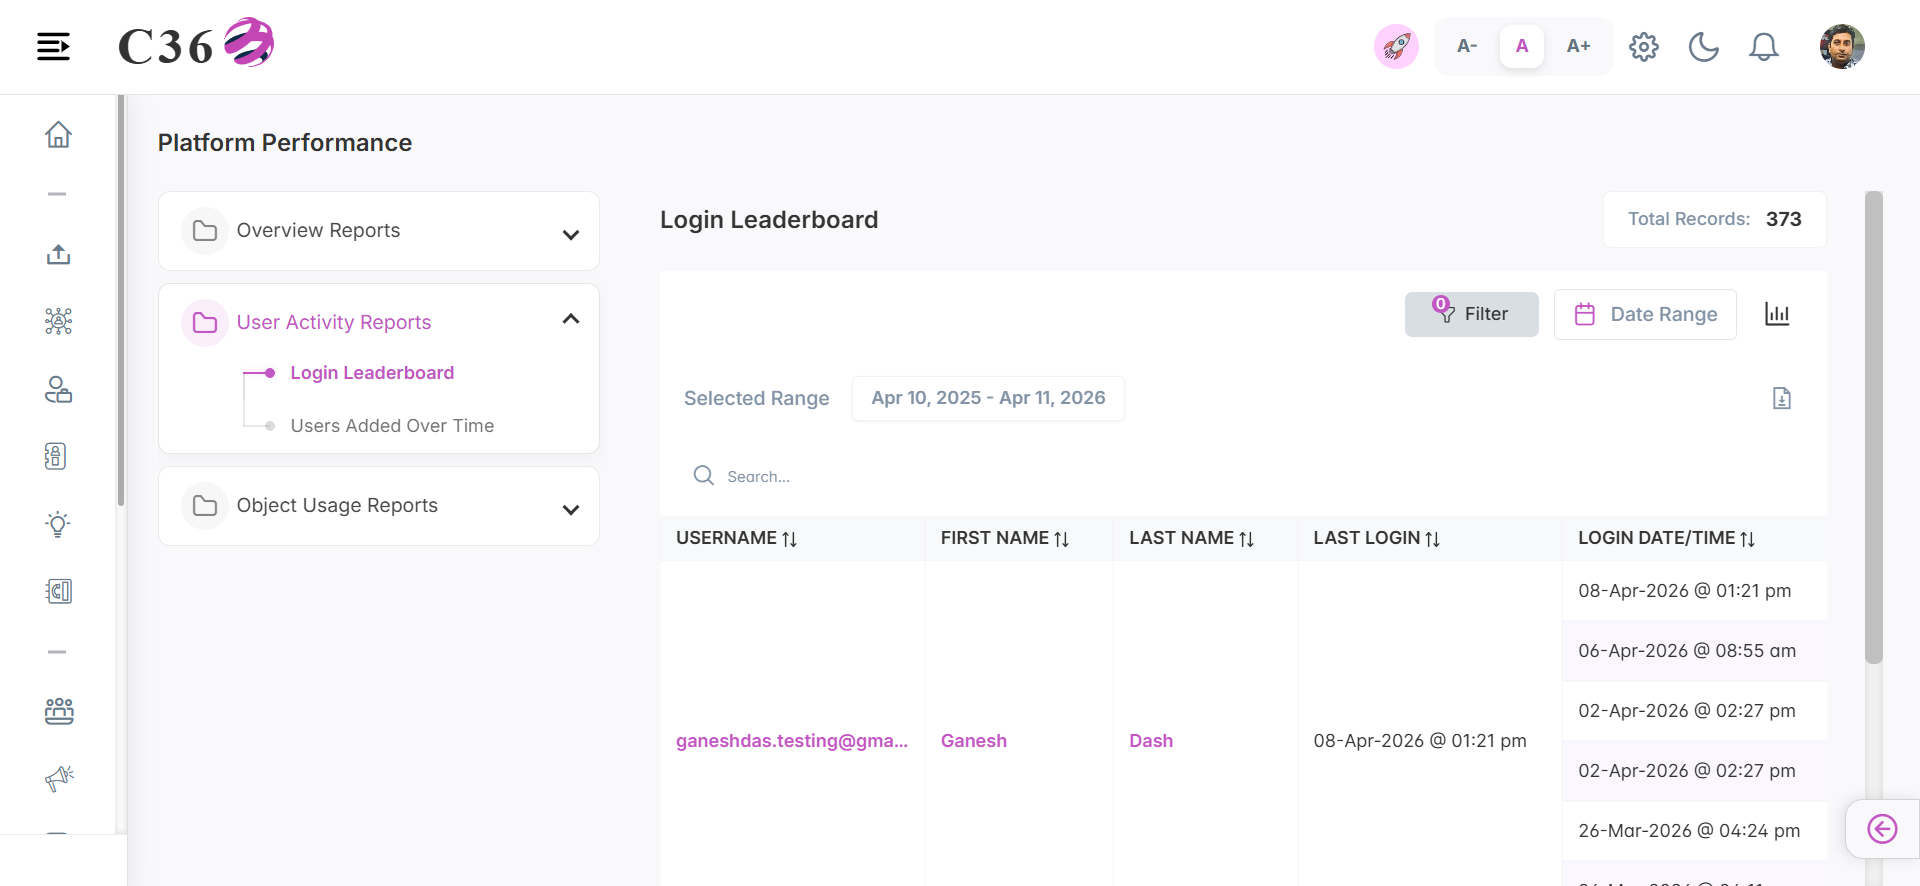
A ranked overview of the most active users based on login frequency, designed to track system adoption and engagement levels.
- 📊 Chart View
- 📋 Table View
Click to see quick actions
- Can Toggle between Table view and Chart view. - Can Export/Download the report. - Can perform Search in table view. - Can Filter by Date Range. - Can Filter by Country, Company and Users.
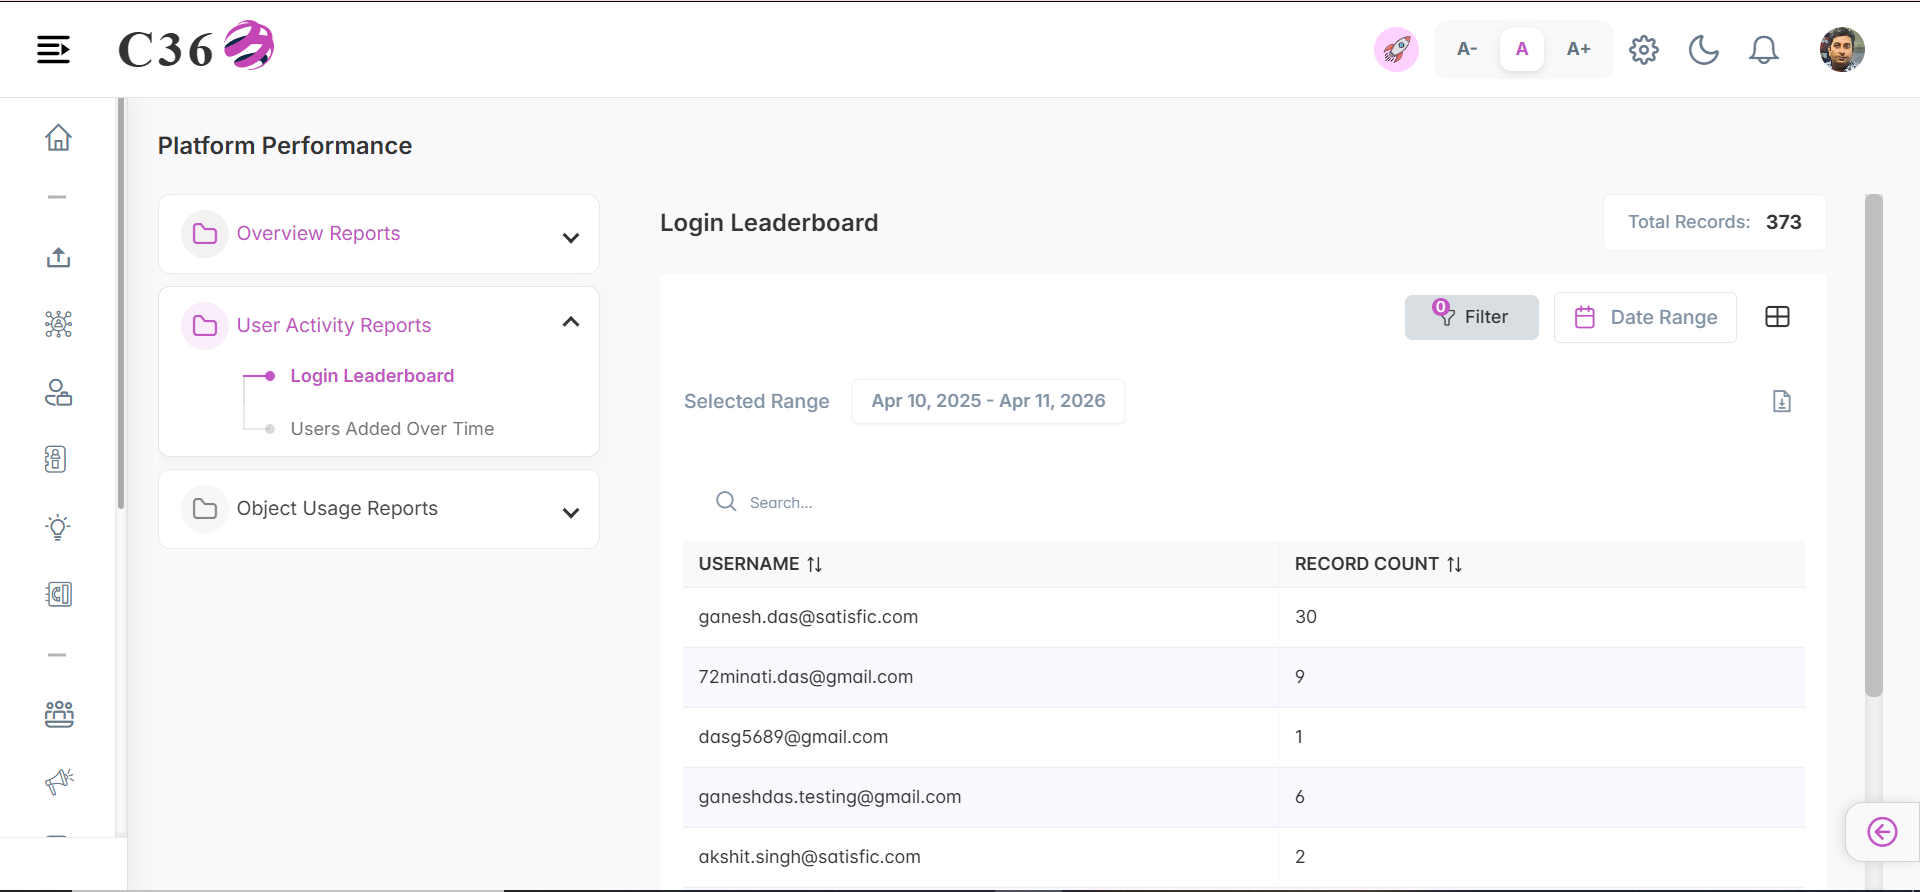
Click to see quick actions
- Can Toggle between Table view and Chart view. - Can perform Search in table view. - Can Export/Download the report. - Can Filter by Date Range. - Can Filter by Country, Company and Users.
🧾 Columns included in the table view
| Column | Description |
|---|---|
| User Name | The full name of the user. |
| Total Logins | The total number of successful logins by the user. |
| Last Login Date | The date and time of the user's most recent login. |
⏳ User Added Over Time
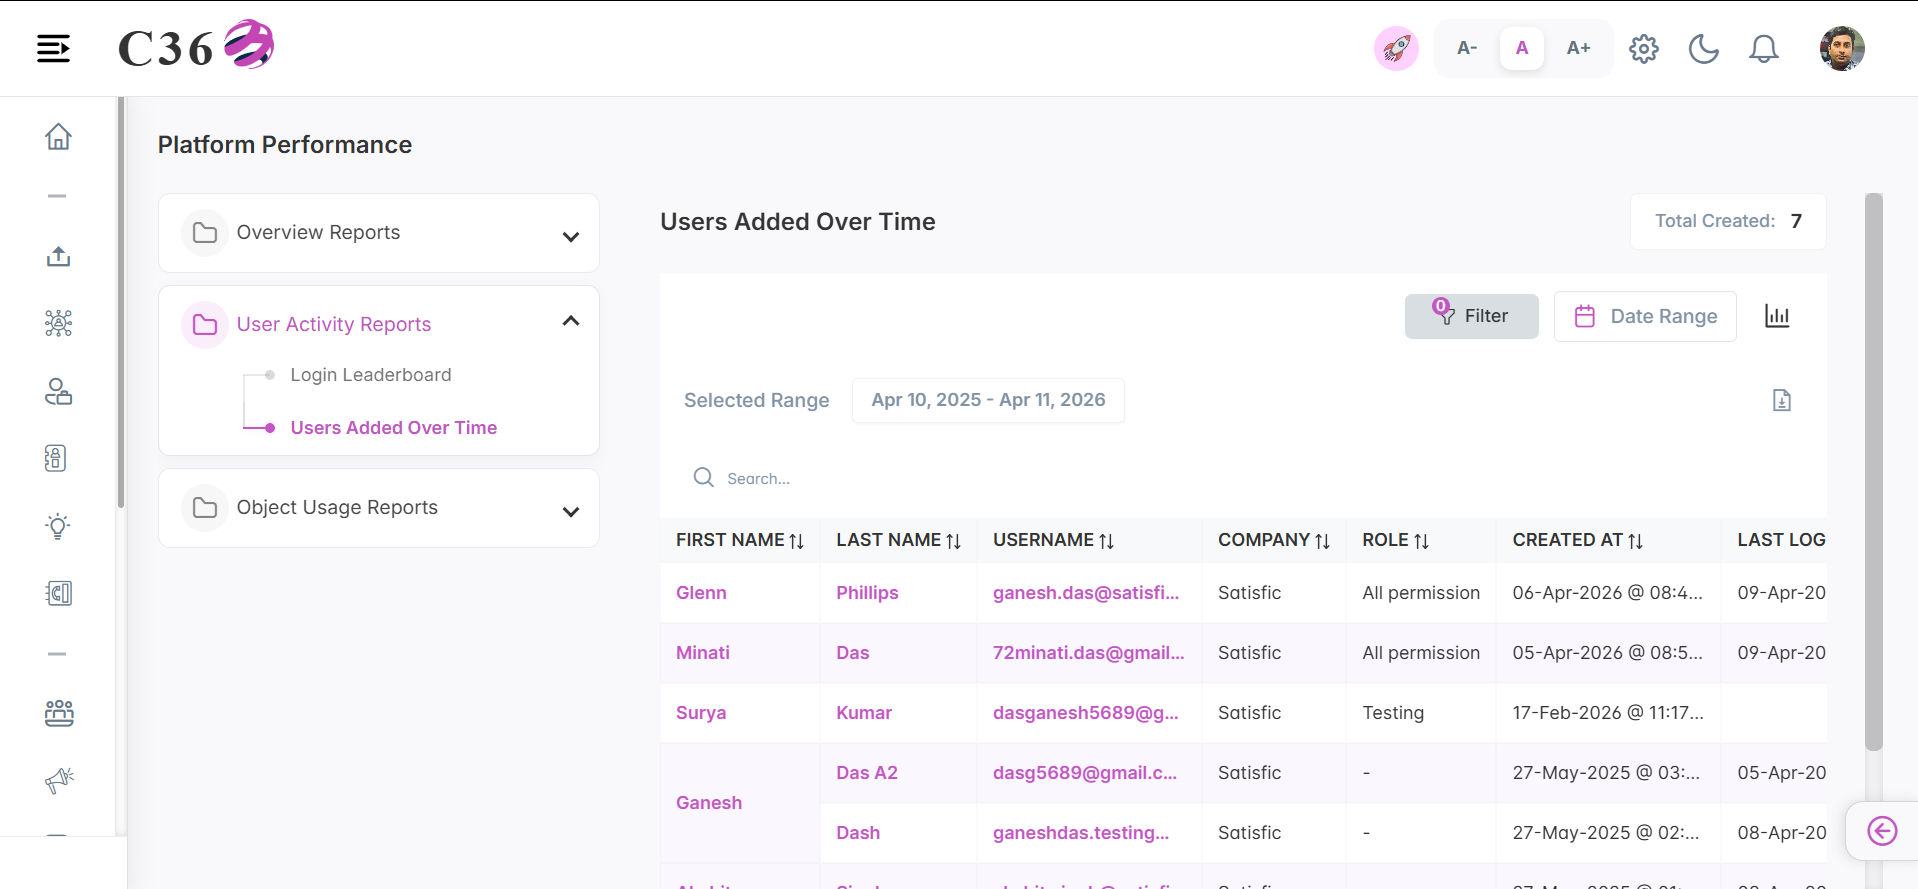
A chronological visualization of new user onboarding, illustrating growth trends and platform adoption rates over a specified period.
- 📊 Chart View
- 📋 Table View
Click to see quick actions
- Can Toggle between Table view and Chart view. - Can Export/Download the report. - Can Filter by Date Range. - Can Filter by Country, Company and Users.
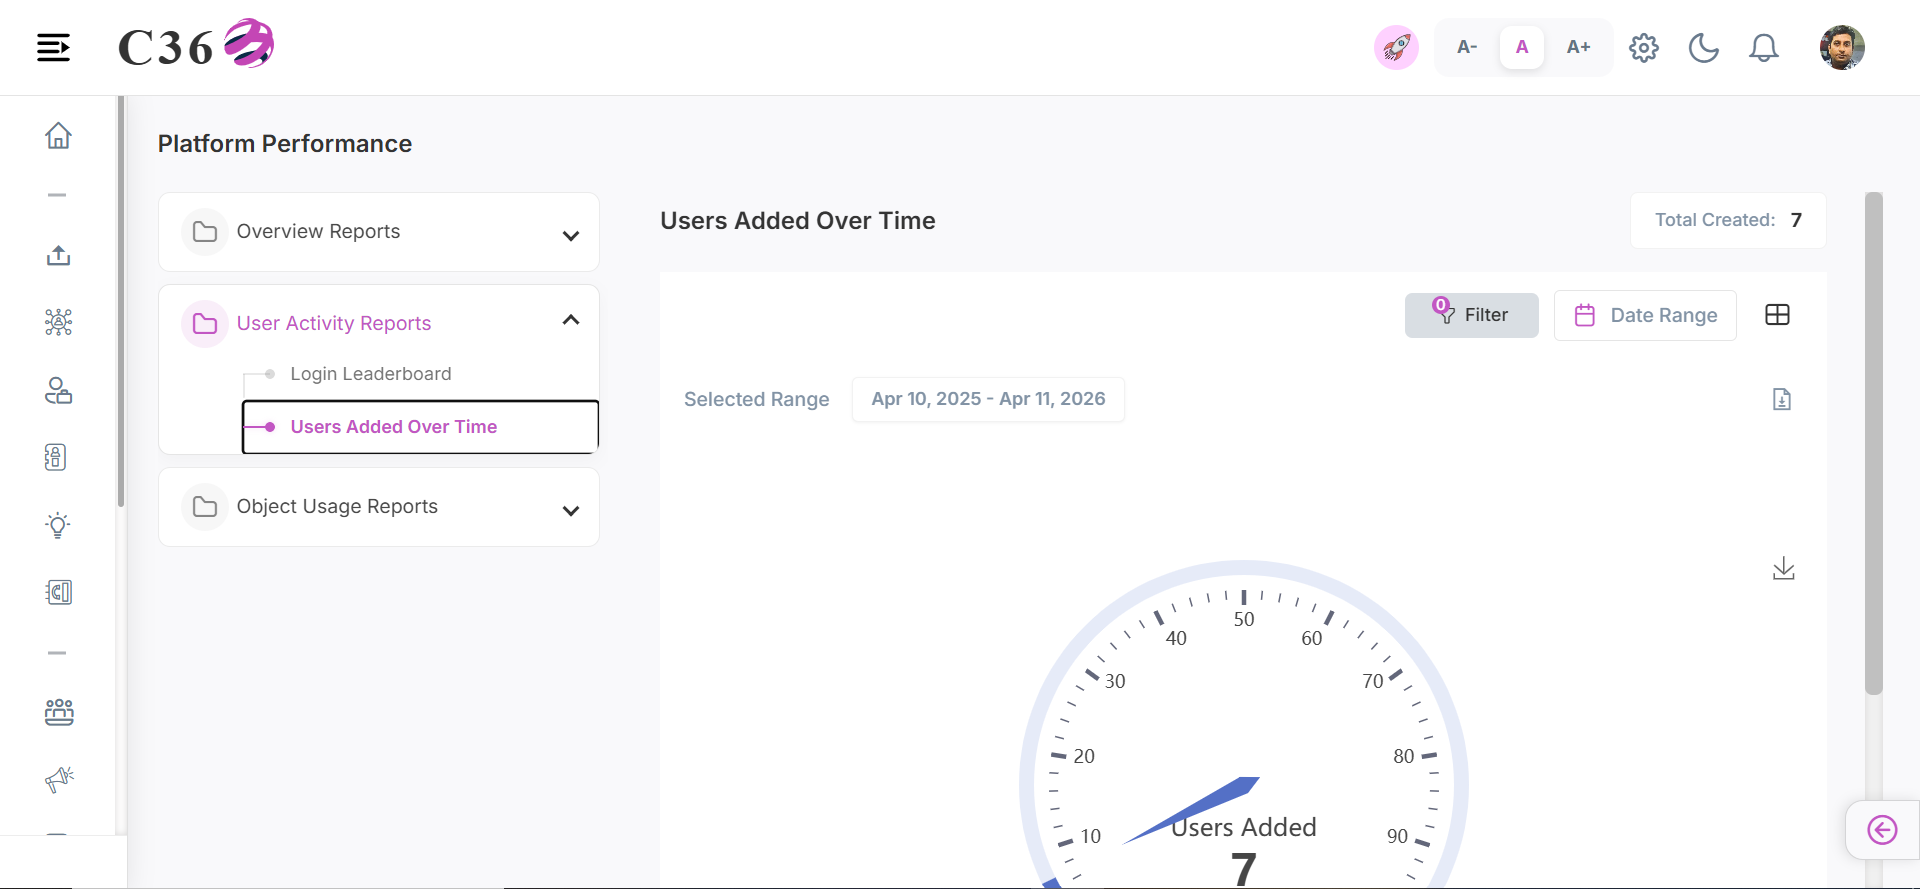
Click to see quick actions
- Can Toggle between Table view and Chart view. - Can perform Search in table view. - Can Export/Download the report. - Can Filter by Date Range. - Can Filter by Country, Company and Users.
🧾 Columns included in the table view.
| Column | Description |
|---|---|
| Date/Period | The time period when users were added. |
| Users Added | The number of new users onboarded during the period. |
━━━━━━━━━━━━━━━━━━━━━━━━━━━━━━━━━━━━━━━━━━━━━━━━━━━━━━━━━━━━━━━━━━━━━━━━━━━━━━━━━━━━━
📦 Object Usage Reports
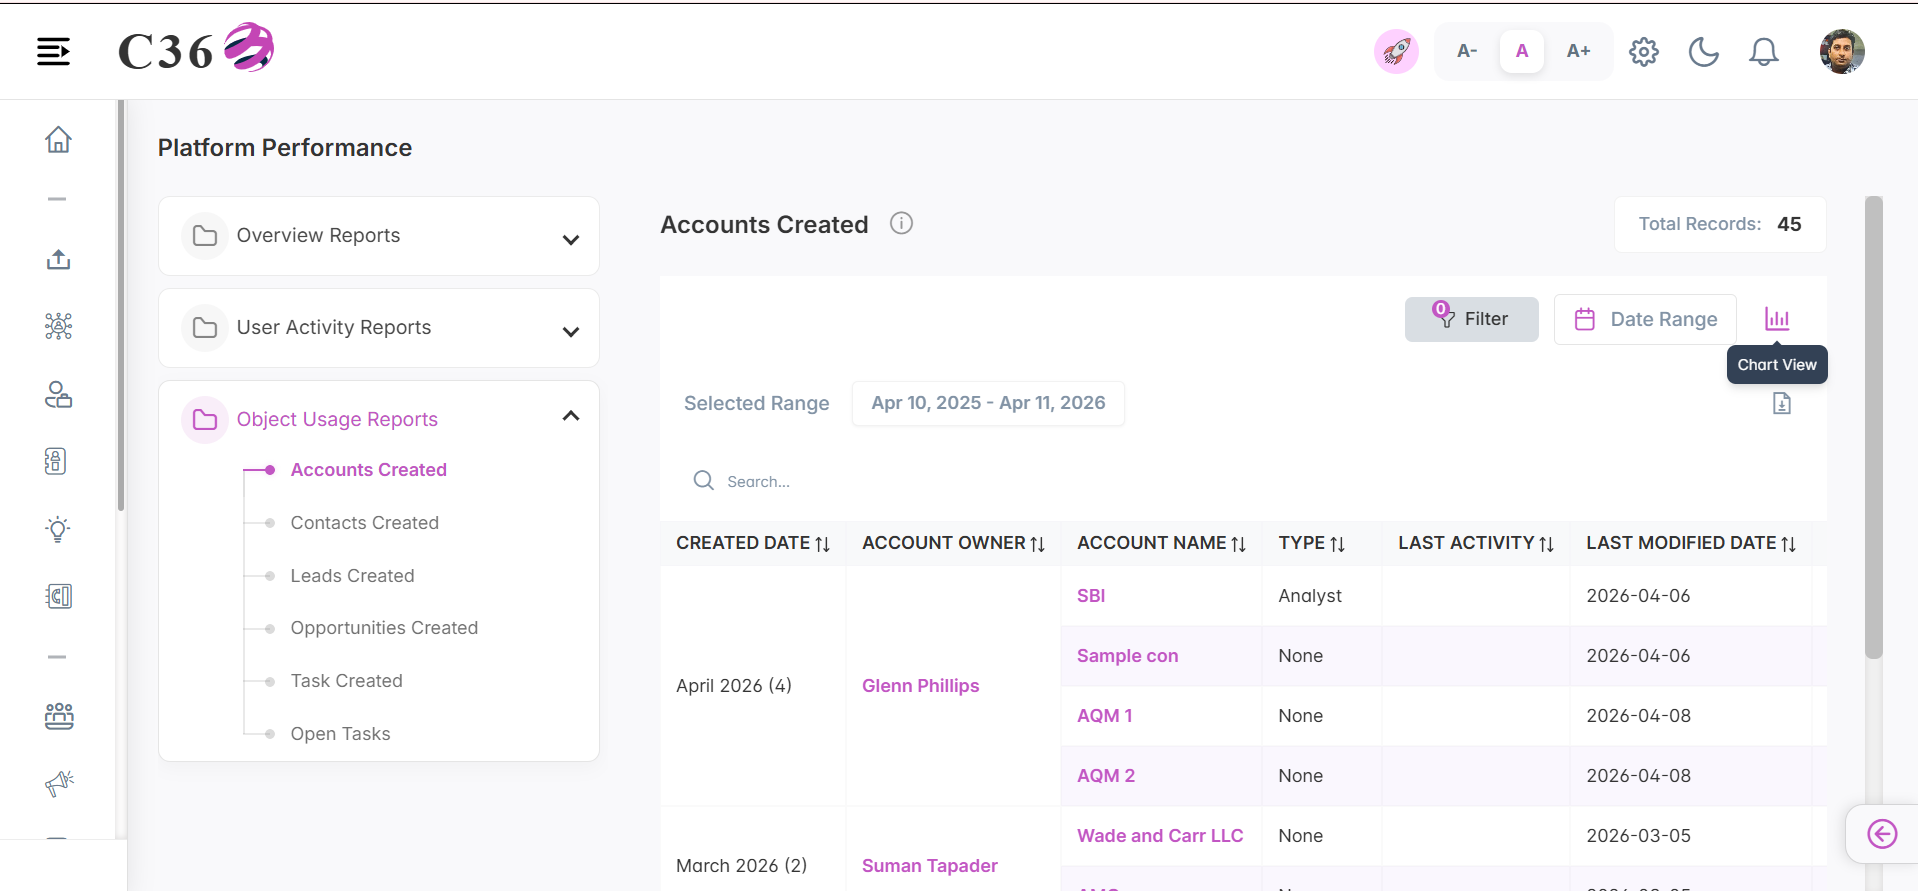
🏢 Accounts Created
A summary of newly established company profiles, offering insights into organizational growth and customer acquisition.
- 📊 Chart View
- 📋 Table View
Click to see quick actions
- Can Toggle between Table view and Chart view. - Can Export/Download the report. - Can Filter by Date Range. - Can Filter by Country, Company and Users. - Toggle between Line chart and Bar chart. - Save the Chart as an image. - Can Restore the bar chart.
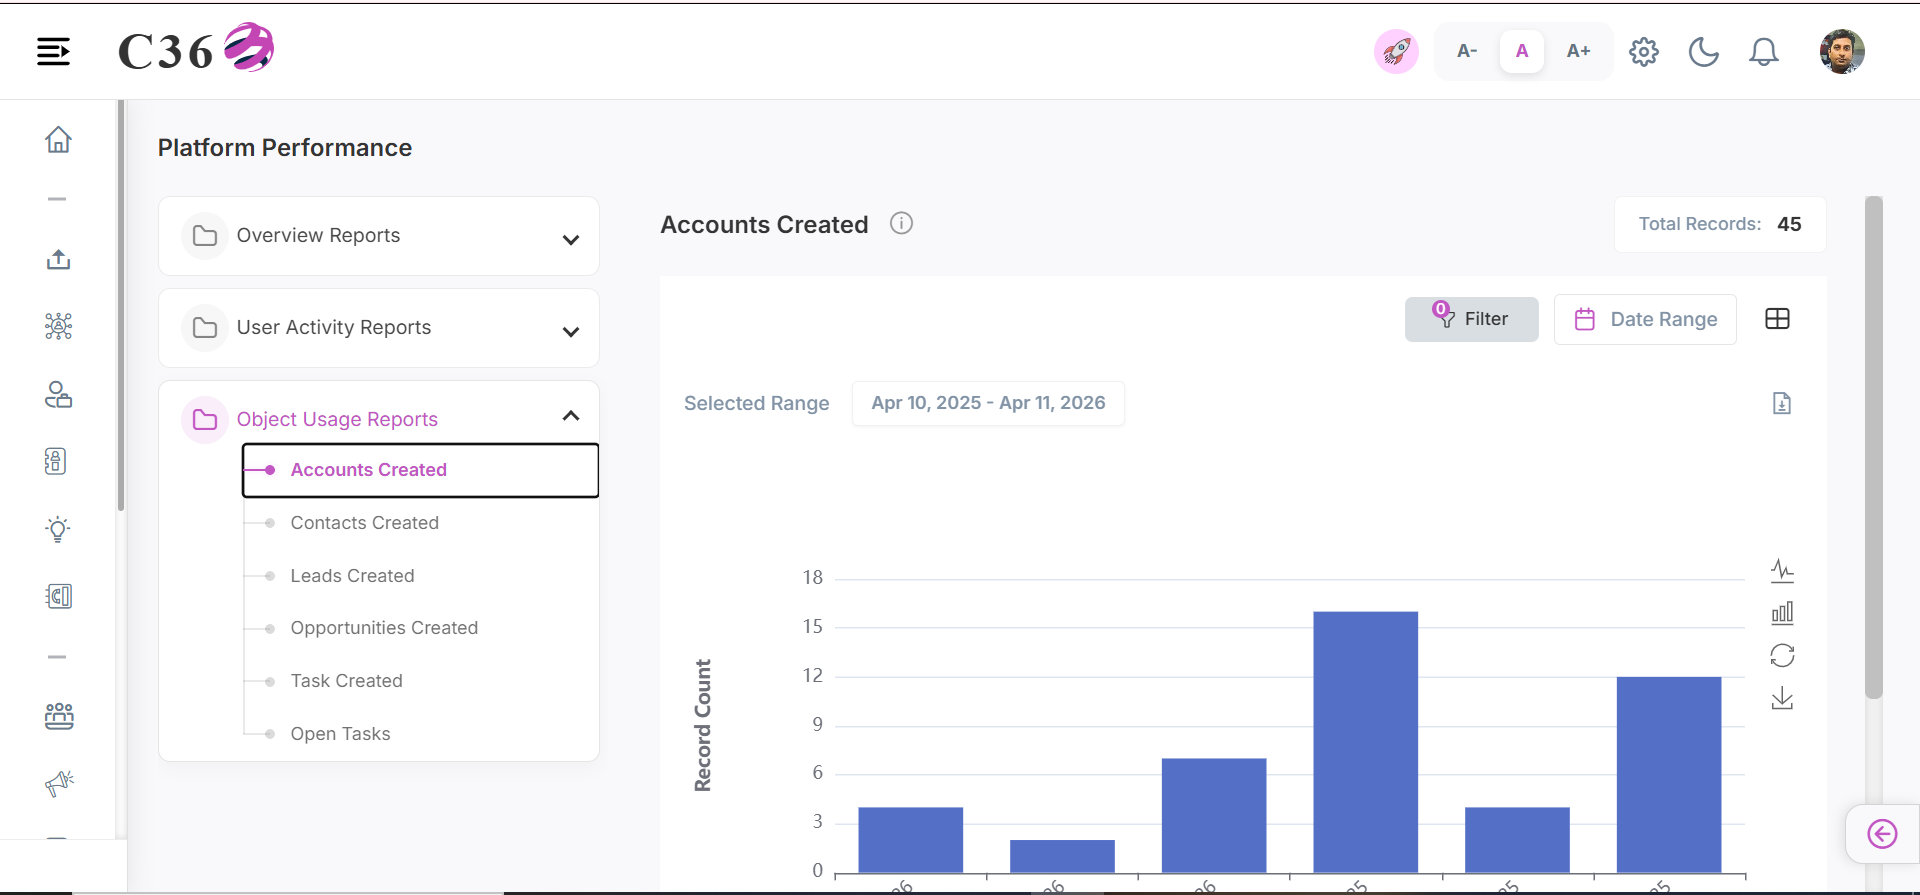
Click to see quick actions
- Can Toggle between Table view and Chart view. - Can perform Search in table view. - Can Export/Download the report. - Can Filter by Date Range. - Can Filter by Country, Company and Users.
🧾 Columns included in the table view.
| Column | Description |
|---|---|
| Date/Period | The time period when accounts were created. |
| Accounts Created | The total number of accounts created during the period. |
📇 Contacts Created
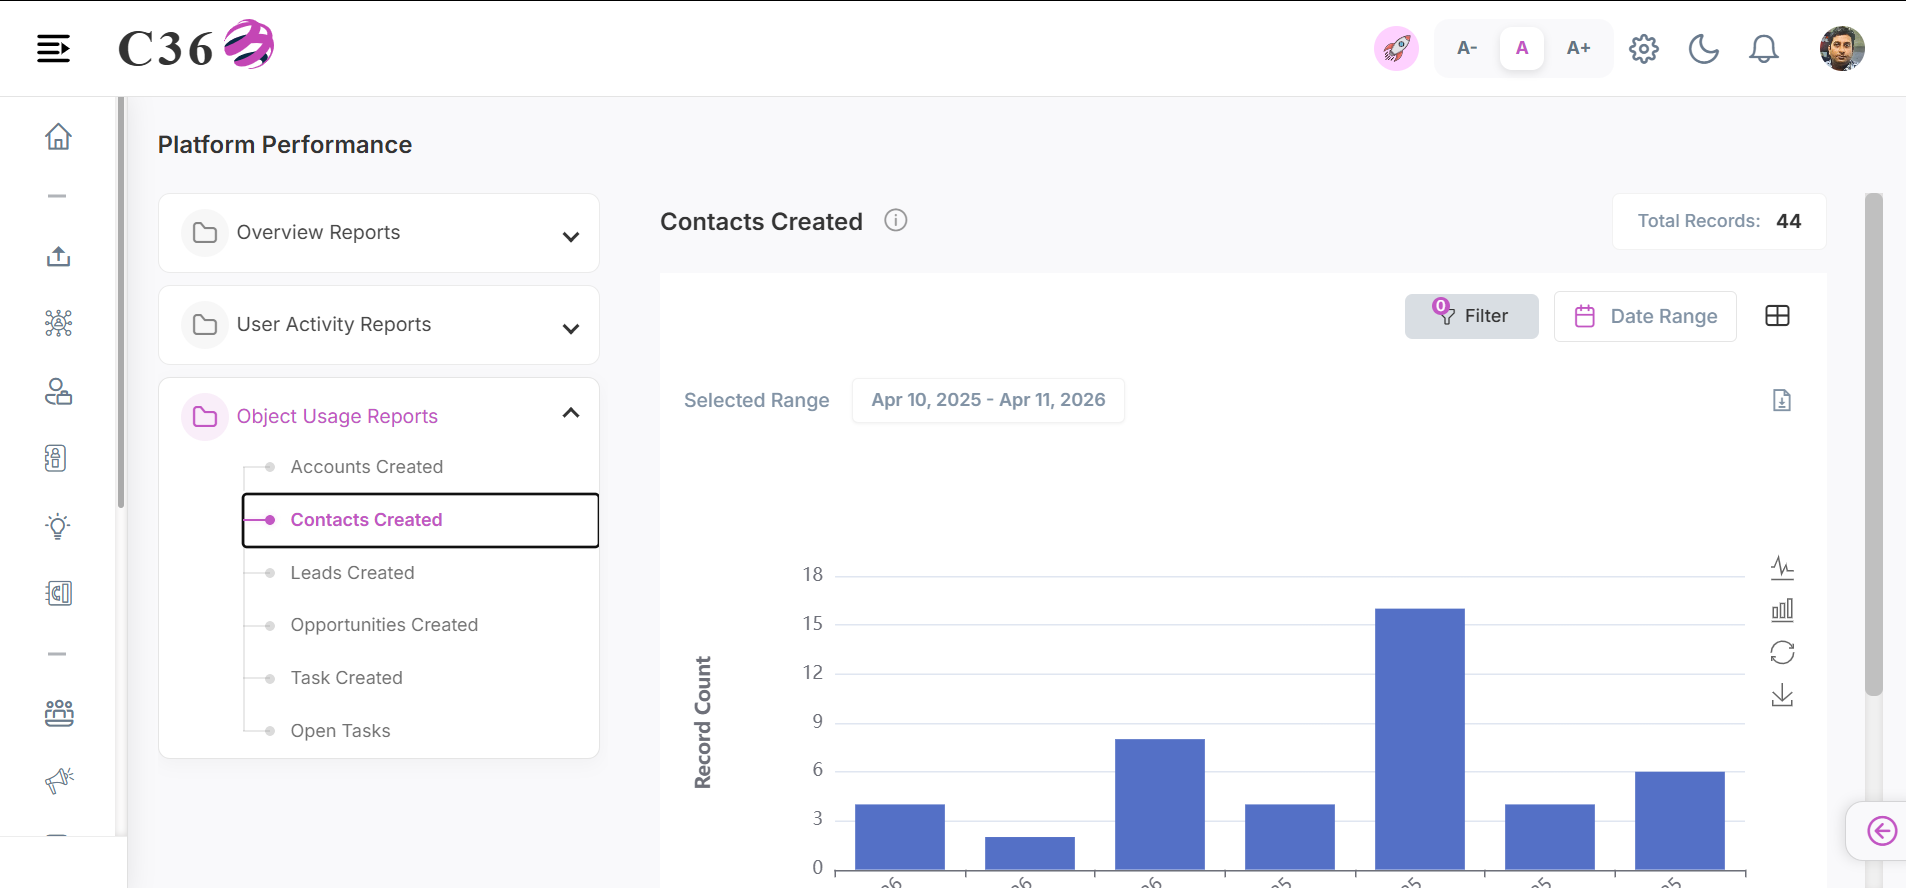
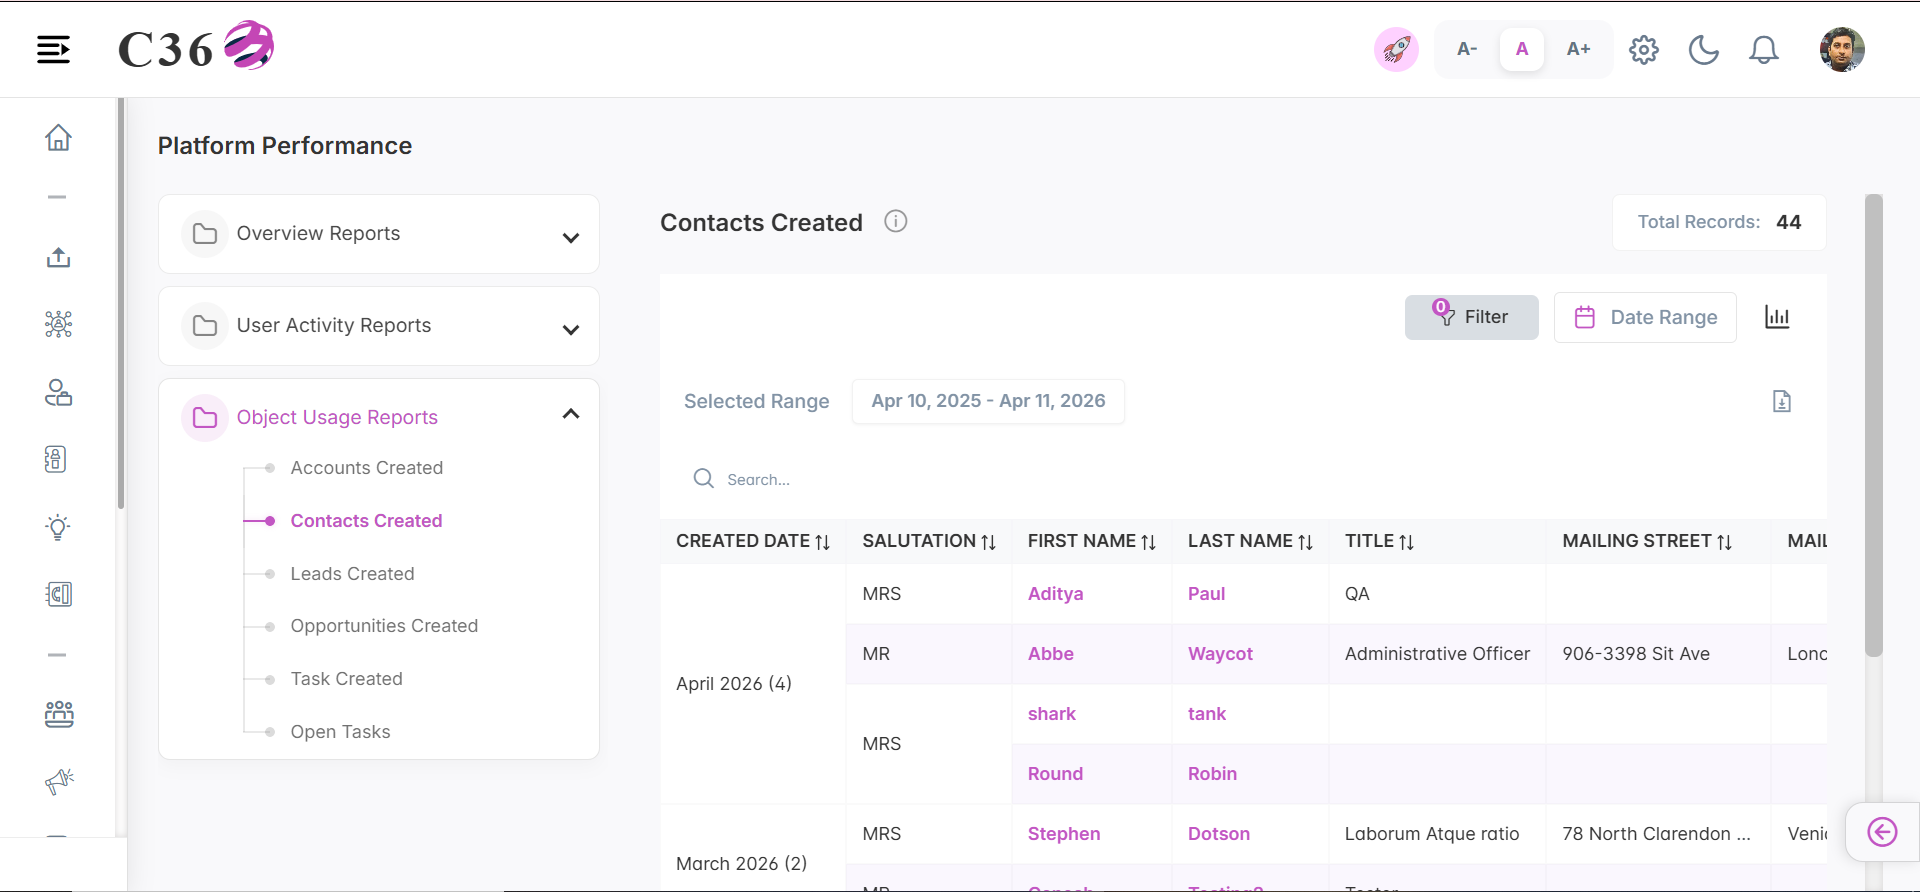
A metric tracking the addition of new individual profiles, reflecting network expansion and relationship-building efforts.
- 📊 Chart View
- 📋 Table View
Click to see quick actions
- Can Toggle between Table view and Chart view. - Can Export/Download the report. - Can Filter by Date Range. - Can Filter by Country, Company and Users. - Toggle between Line chart and Bar chart. - Save the Chart as an image. - Can Restore the bar chart.
Click to see quick actions
- Can Toggle between Table view and Chart view. - Can perform Search in table view. - Can Export/Download the report. - Can Filter by Date Range. - Can Filter by Country, Company and Users.
🧾 Columns included in the table view.
| Column | Description |
|---|---|
| Date/Period | The time period when contacts were created. |
| Contacts Created | The total number of contacts created during the period. |
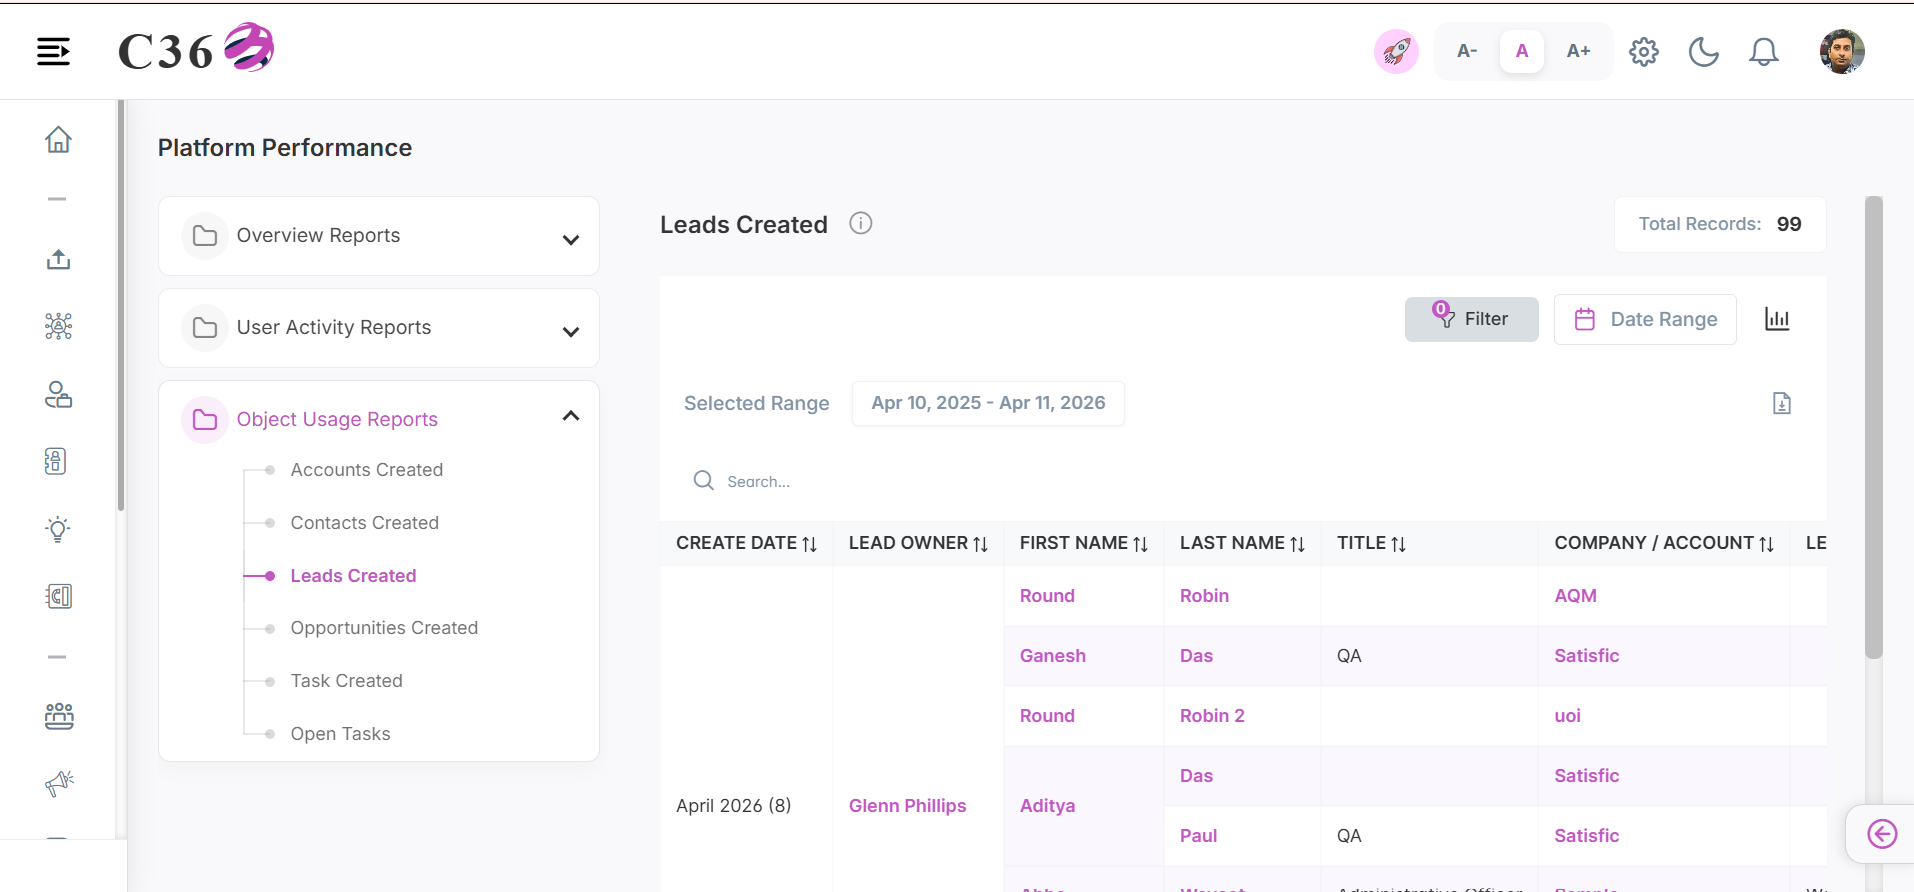
🎯 Leads Created
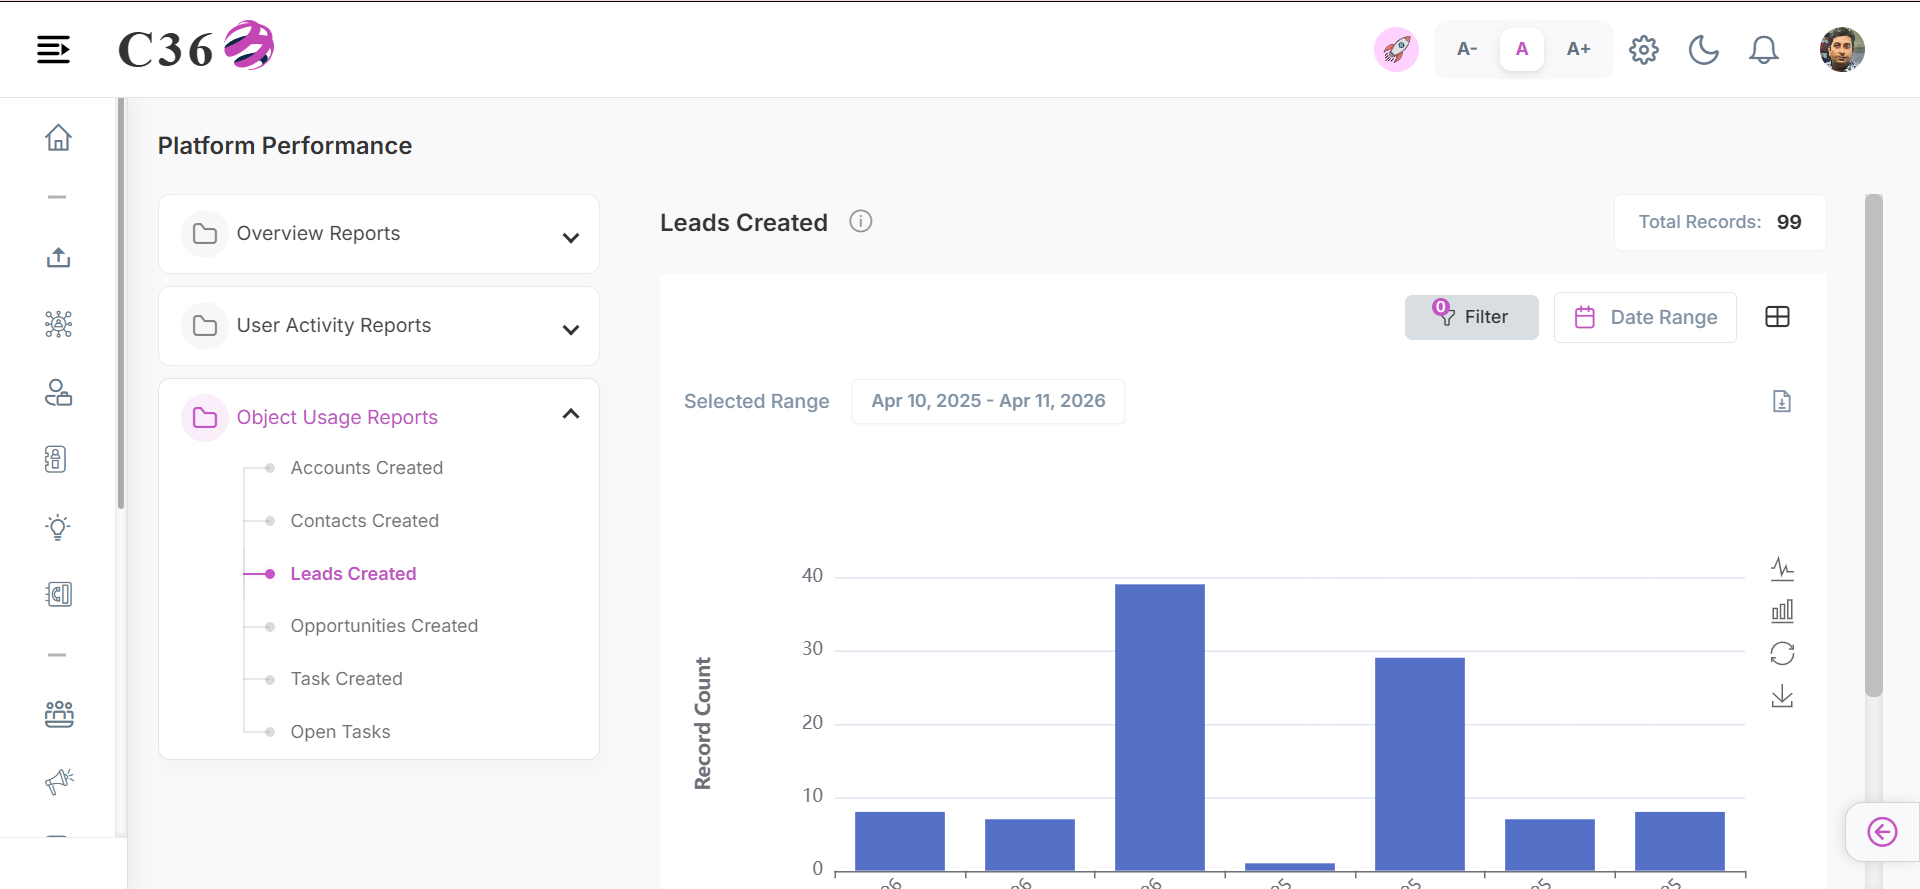
An analytical breakdown of newly identified prospects, providing visibility into the effectiveness of marketing and outreach campaigns.
- 📊 Chart View
- 📋 Table View
Click to see quick actions
- Can Toggle between Table view and Chart view. - Can Export/Download the report. - Can Filter by Date Range. - Can Filter by Country, Company and Users. - Toggle between Line chart and Bar chart. - Save the Chart as an image. - Can Restore the bar chart.
Click to see quick actions
- Can Toggle between Table view and Chart view. - Can perform Search in table view. - Can Export/Download the report. - Can Filter by Date Range. - Can Filter by Country, Company and Users.
🧾 Columns included in the table view.
| Column | Description |
|---|---|
| Date/Period | The time period when leads were created. |
| Leads Created | The total number of leads created during the period. |
💼 Opportunities Created
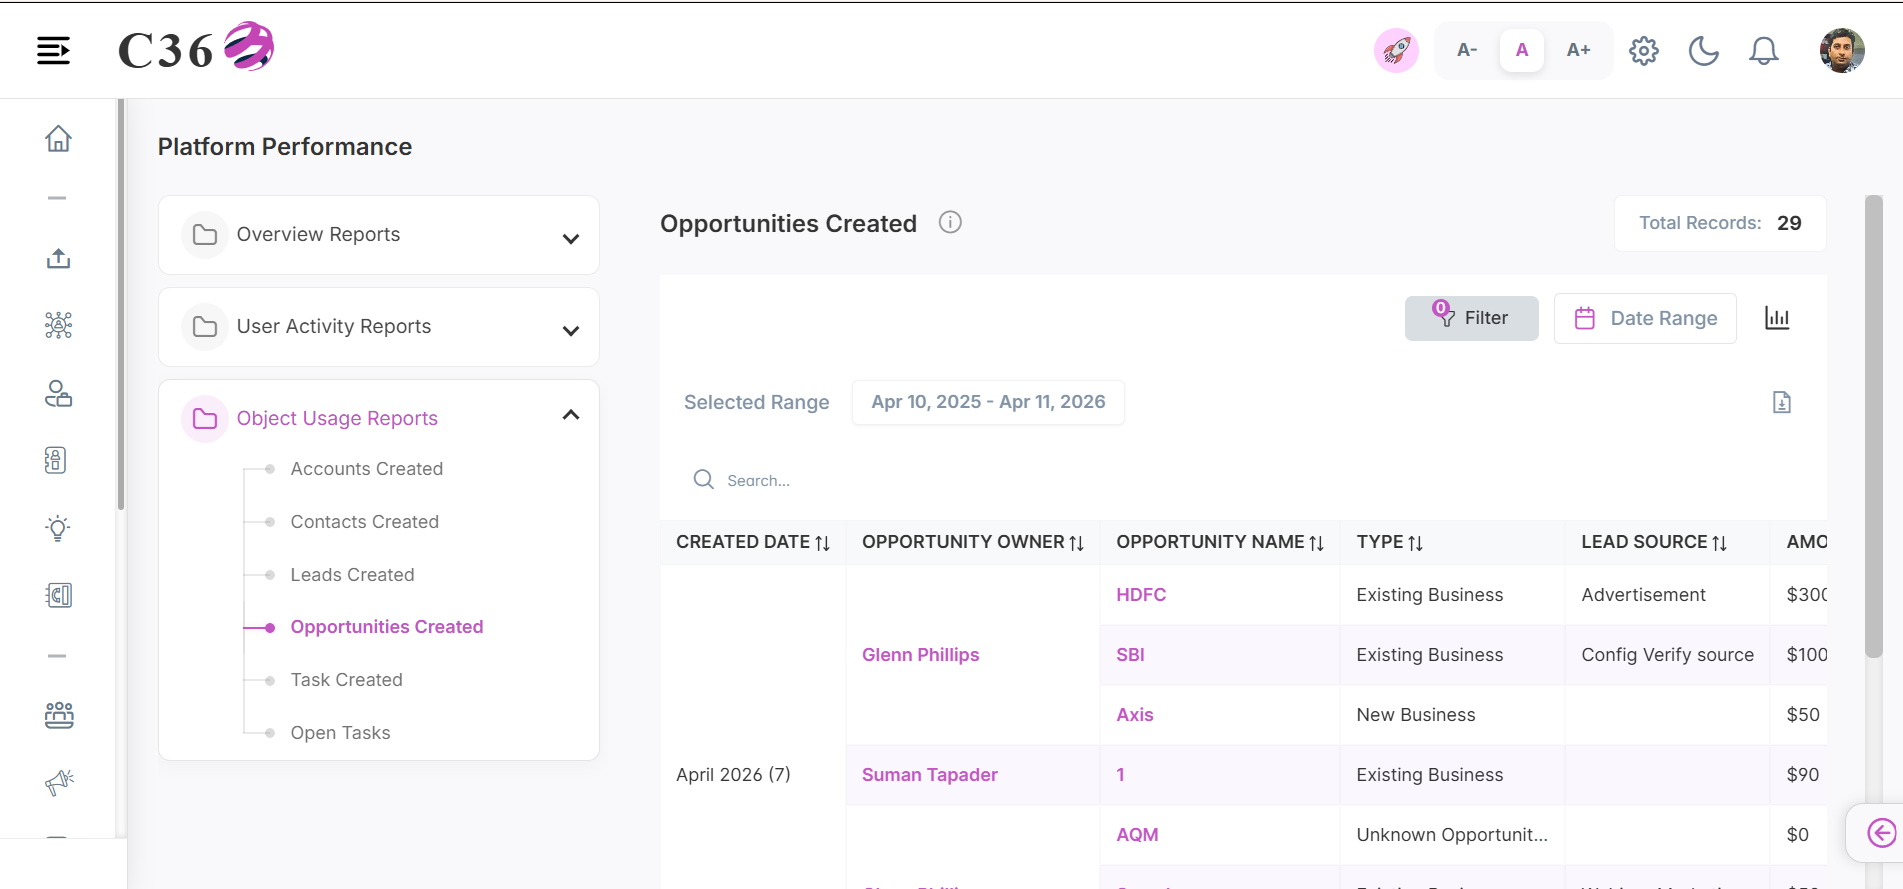
A strategic overview of newly initiated sales opportunities, indicating business development momentum and pipeline health.
- 📊 Chart View
- 📋 Table View
Click to see quick actions
- Can Toggle between Table view and Chart view. - Can Export/Download the report. - Can Filter by Date Range. - Can Filter by Country, Company and Users. - Toggle between Line chart and Bar chart. - Save the Chart as an image. - Can Restore the bar chart.
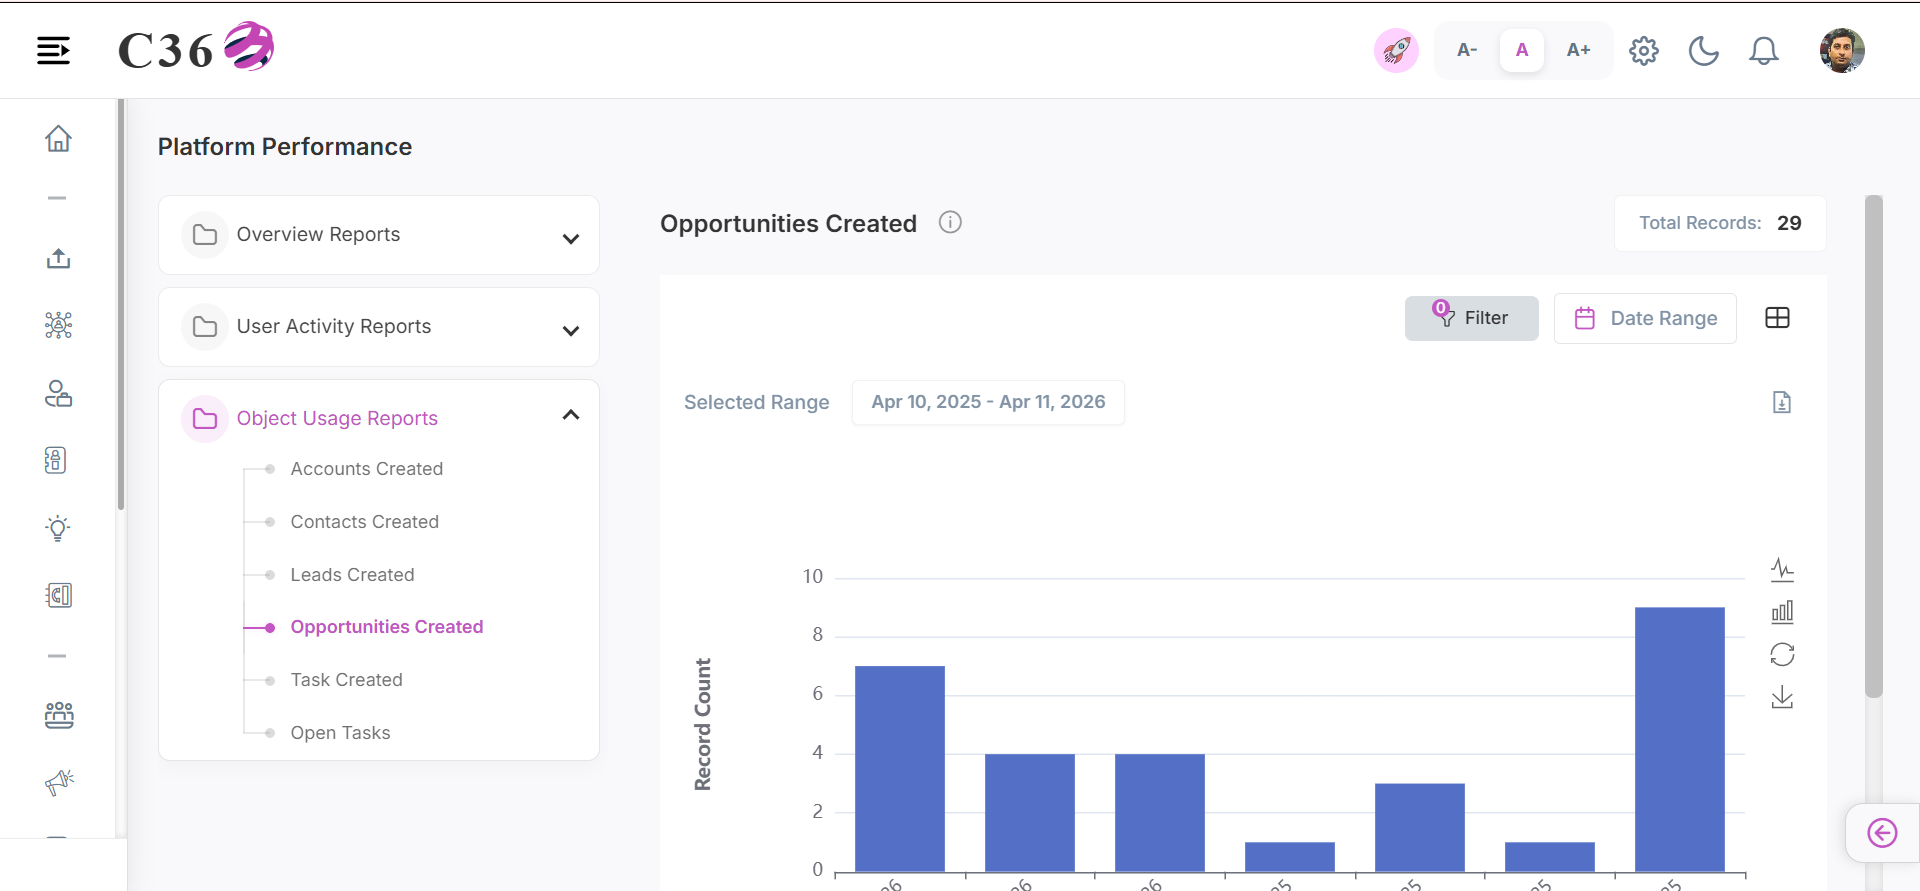
Click to see quick actions
- Can Toggle between Table view and Chart view. - Can perform Search in table view. - Can Export/Download the report. - Can Filter by Date Range. - Can Filter by Country, Company and Users.
🧾 Columns included in the table view.
| Column | Description |
|---|---|
| Date/Period | The time period when opportunities were created. |
| Opportunities Created | The total number of opportunities created during the period. |
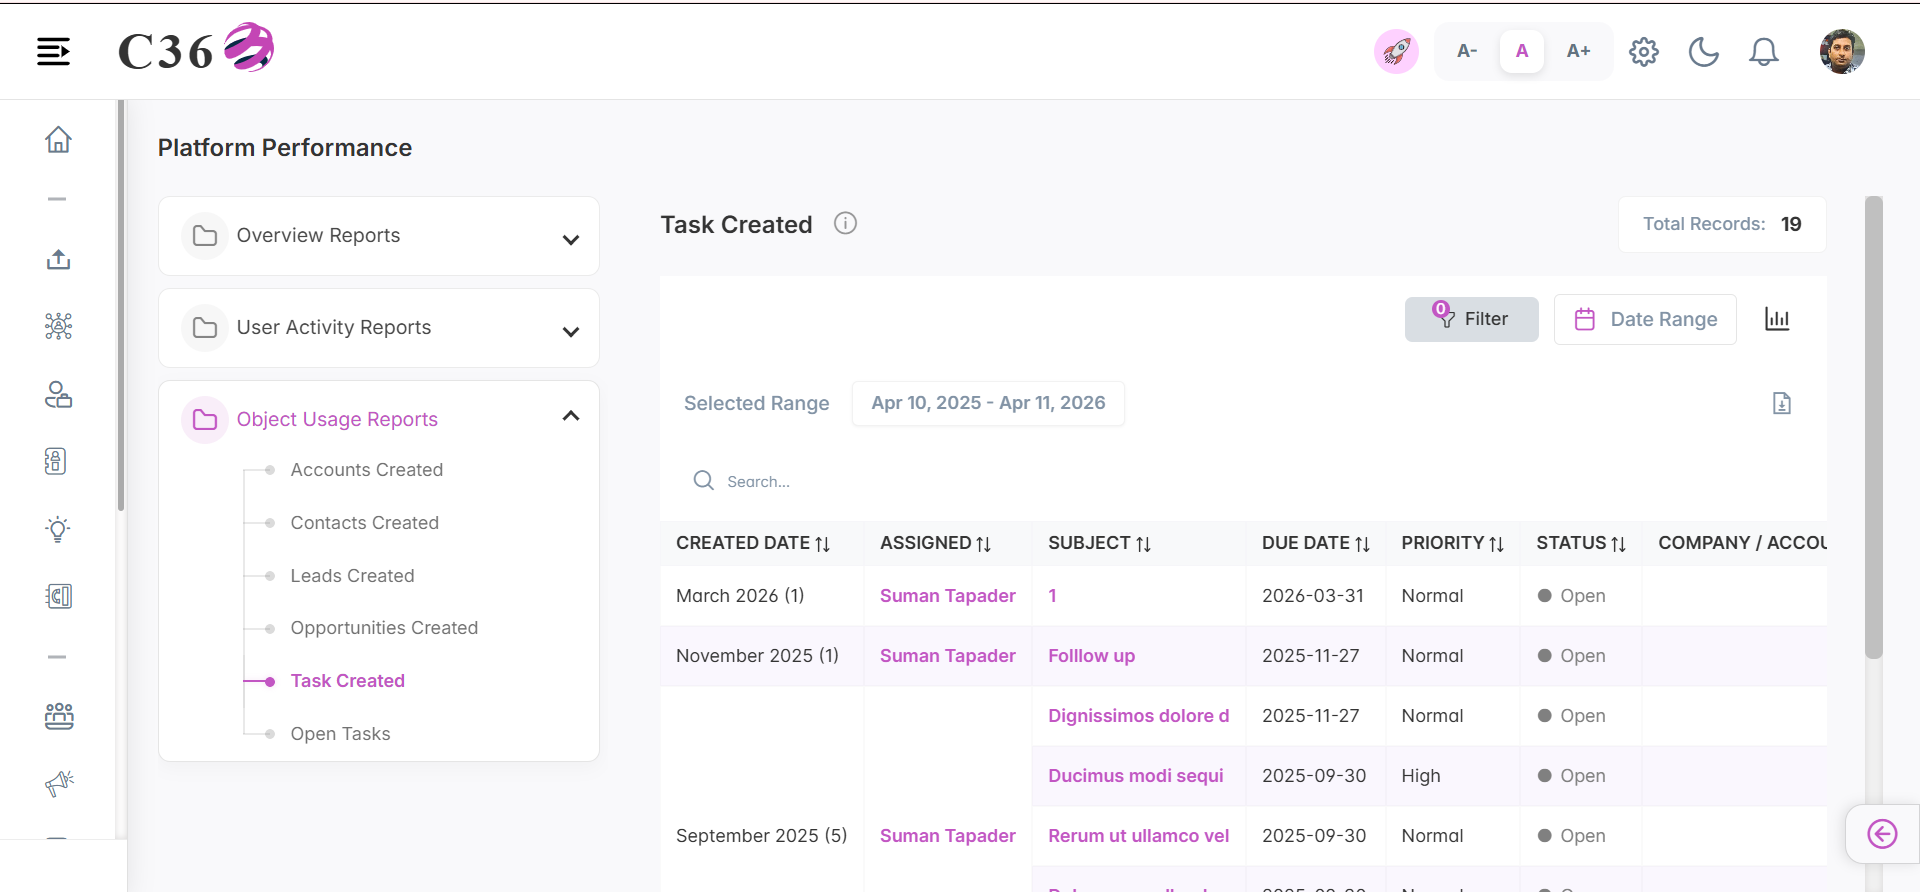
✅ Tasks Created
A productivity metric capturing the volume of new activities logged, helping gauge operational workflow and task delegation.
- 📊 Chart View
- 📋 Table View
Click to see quick actions
- Can Toggle between Table view and Chart view. - Can Export/Download the report. - Can Filter by Date Range. - Can Filter by Country, Company and Users. - Toggle between Line chart and Bar chart. - Save the Chart as an image. - Can Restore the bar chart.
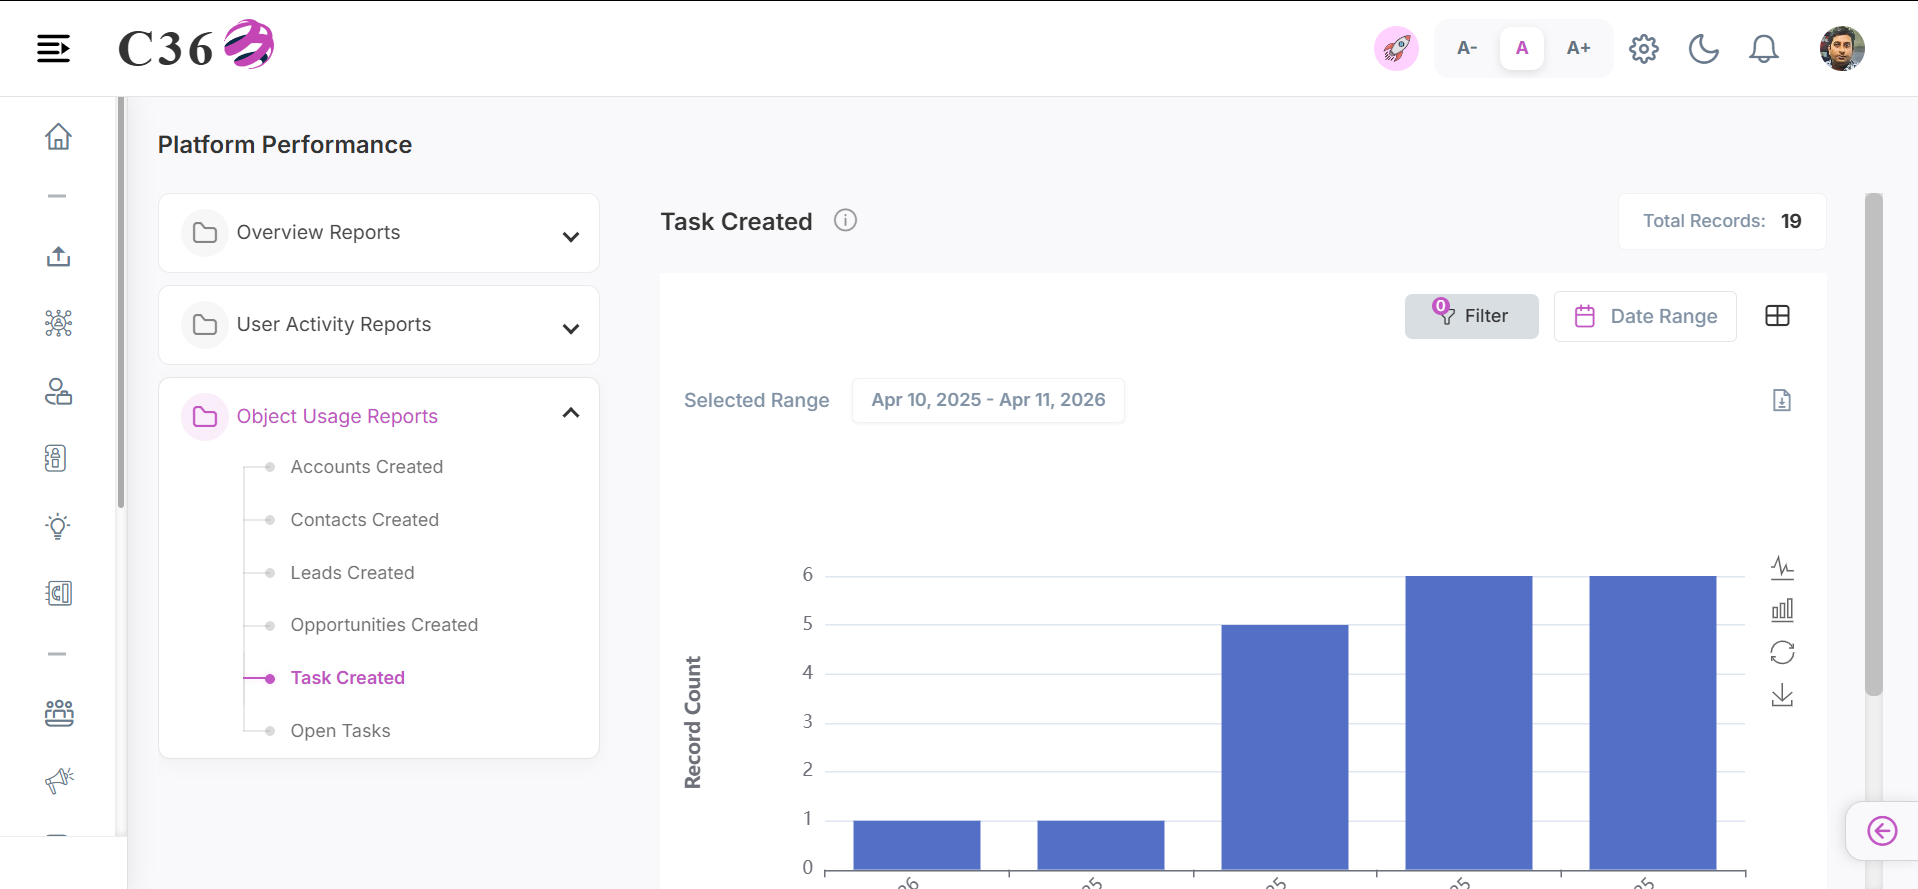
Click to see quick actions
- Can Toggle between Table view and Chart view. - Can perform Search in table view. - Can Export/Download the report. - Can Filter by Date Range. - Can Filter by Country, Company and Users.
🧾 Columns included in the table view.
| Column | Description |
|---|---|
| Date/Period | The time period when tasks were created. |
| Tasks Created | The total number of tasks created during the period. |
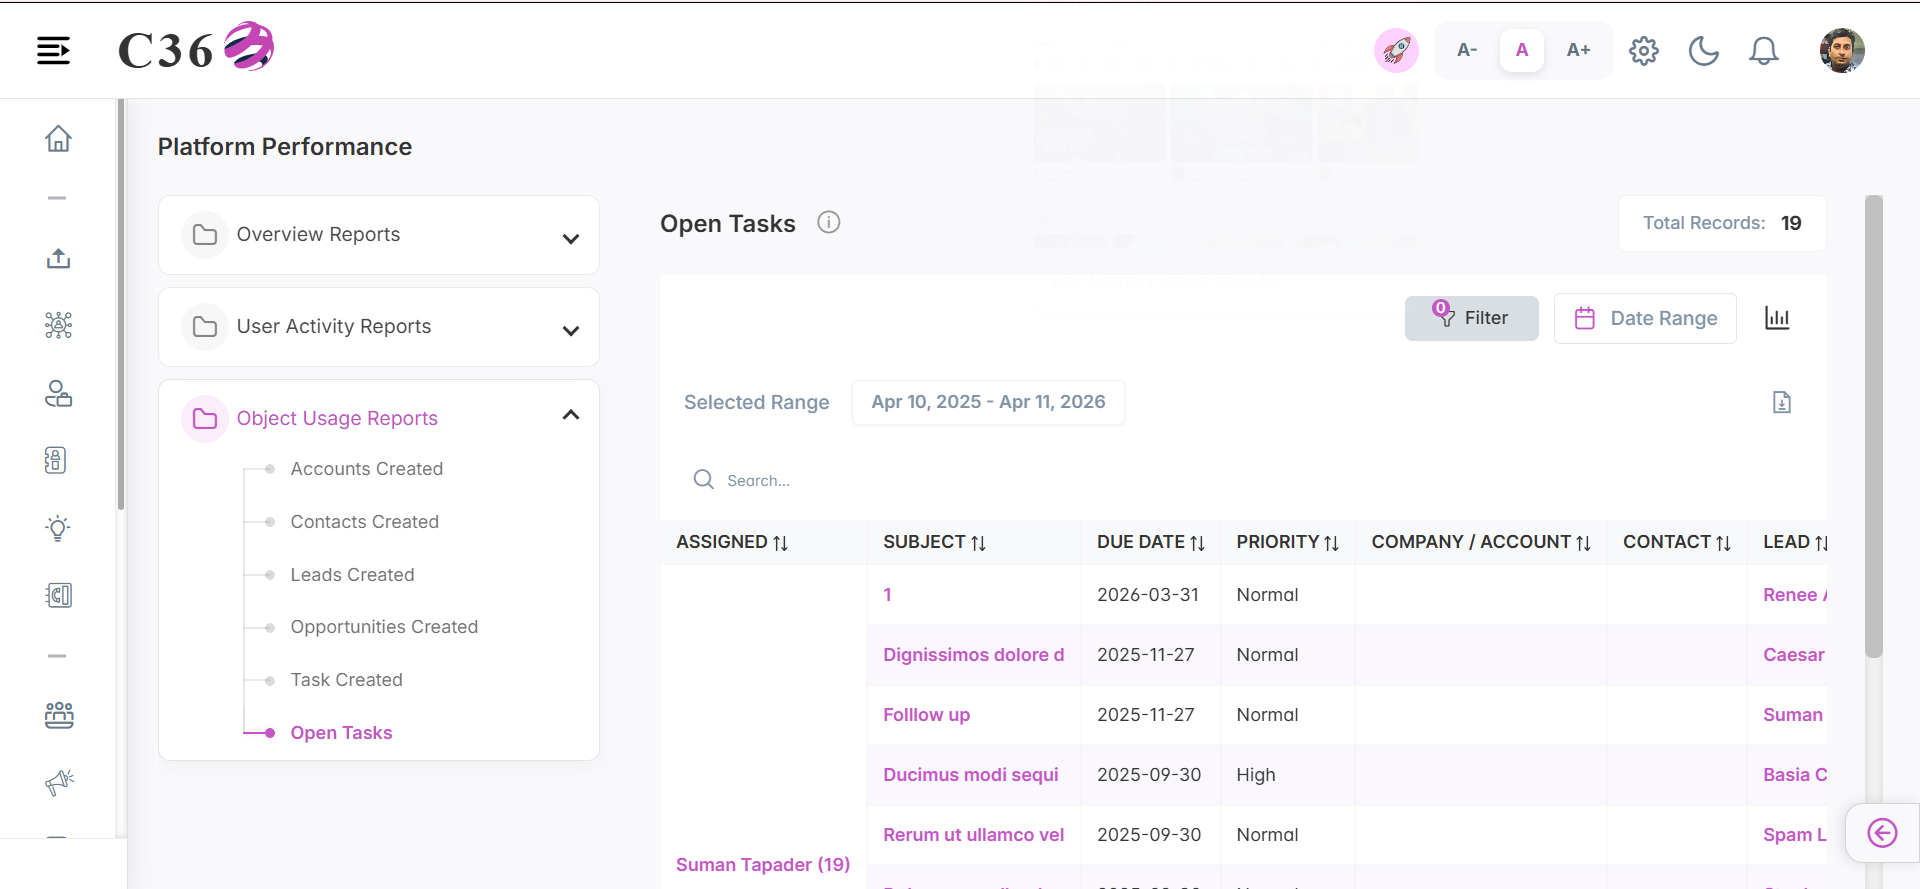
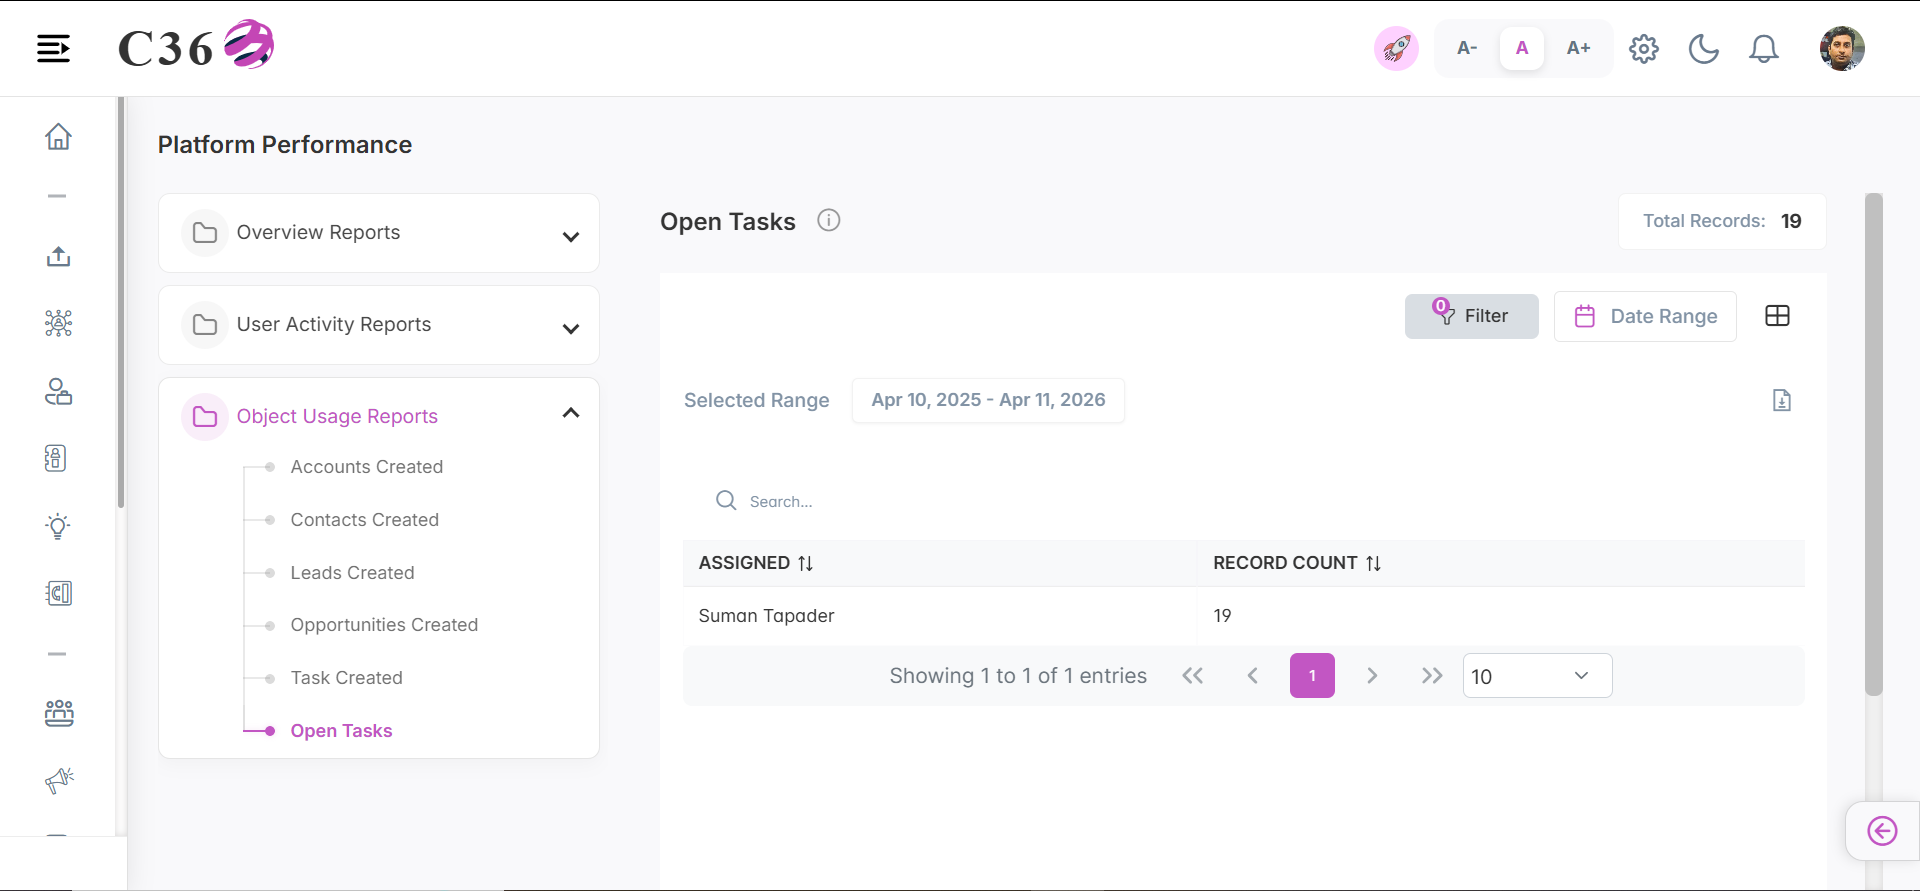
⌛ Open Tasks
A real-time snapshot of pending and unresolved activities, aimed at assisting teams in workload prioritization and management.
- 📊 Chart View
- 📋 Table View
Click to see quick actions
- Can Toggle between Table view and Chart view. - Can perform Search in table view. - Can Export/Download the report. - Can Filter by Date Range. - Can Filter by Country, Company and Users.
Click to see quick actions
- Can Toggle between Table view and Chart view. - Can perform Search in table view. - Can Export/Download the report. - Can Filter by Date Range. - Can Filter by Country, Company and Users.
🧾 Columns included in the table view.
| Column | Description |
|---|---|
| Task Status | The current state of the open task. |
| Tasks Count | The number of tasks currently open. |